Clinic analytics software
Turn your clinic data into actionable decisions
You already generate data at every check-in. EyeHMS surfaces patient load, service time, and trends—so you adjust staffing and doctor blocks before patients feel the pinch.
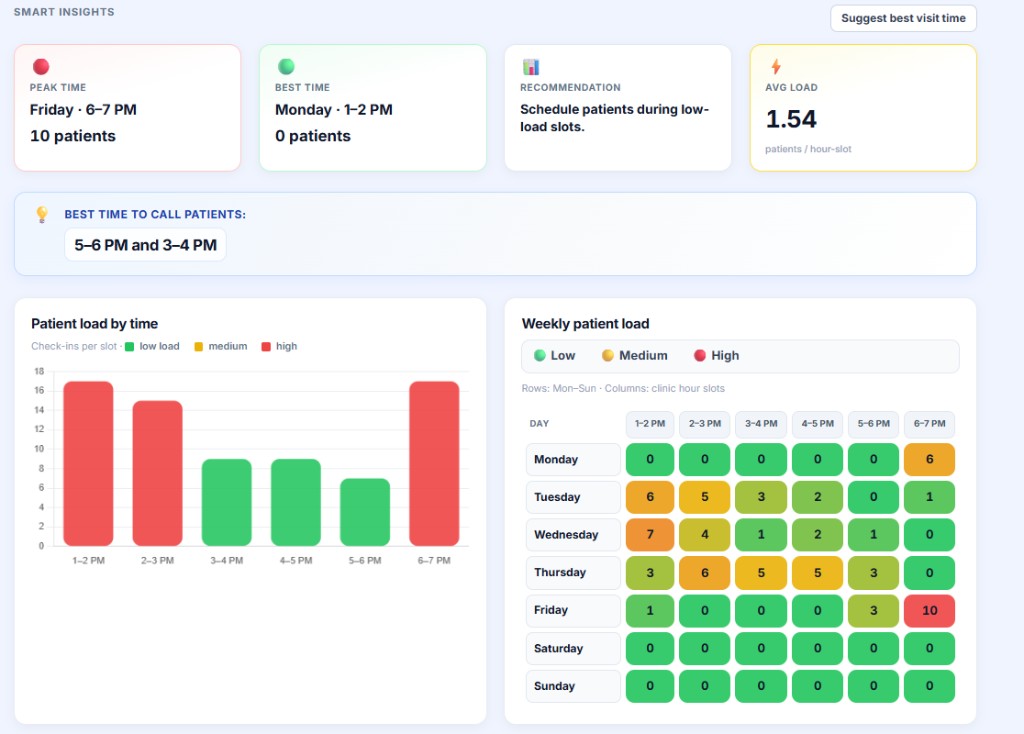
Patient load by time
See how check-ins distribute across clinic hours—not just “busy today.” Align lunch breaks, second counters, and camp follow-ups when the curve says you should.
Why doctors care: fewer bottlenecks = higher trust and more completed consultations per day.
Weekly & range views
Compare today vs last week, or roll up seven and thirty days for board-level clarity. Spot the day that always spikes—then plan inventory and manpower.
Why owners care: marketing spend and outreach days stop being guesswork.
Service time signals
Average time from check-in to completion highlights friction: counselling backlog, refraction steps, or documentation delays.
Why HODs care: fix the slow stage without blaming individuals.
Smart suggestion layer
Narrative insight lines call out peak days and period-over-period movement—plain language your admin understands in seconds.
Patient load management system: operational, not academic.
Heatmap mindset
Think of your week as a heatmap: darker blocks mean heavier patient load. EyeHMS analytics gives you the numbers to paint that picture—visit counts per day, new registrations, and efficiency deltas versus the prior period.
- Total visits trend
- New patient registrations
- Avg service time (lower is better)
Want the numbers on a live screen share?
Book free demo